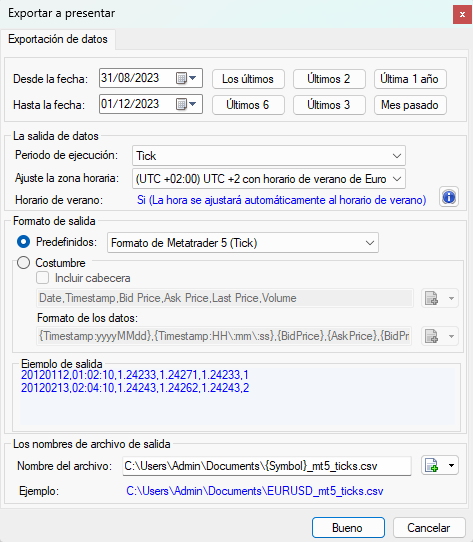
We have downloaded data for 3 months, exactly from 08/31/2023 to 12/01/2023 for the EURUSD, specifically in this way:
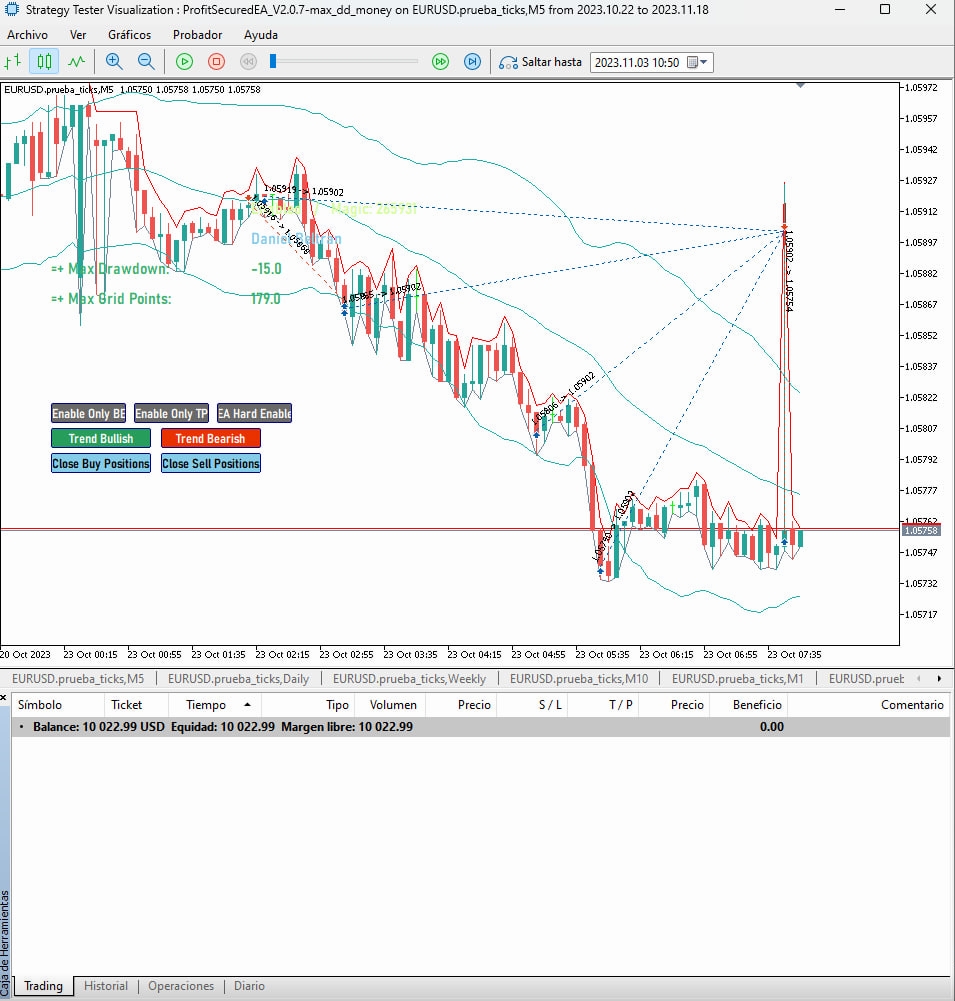
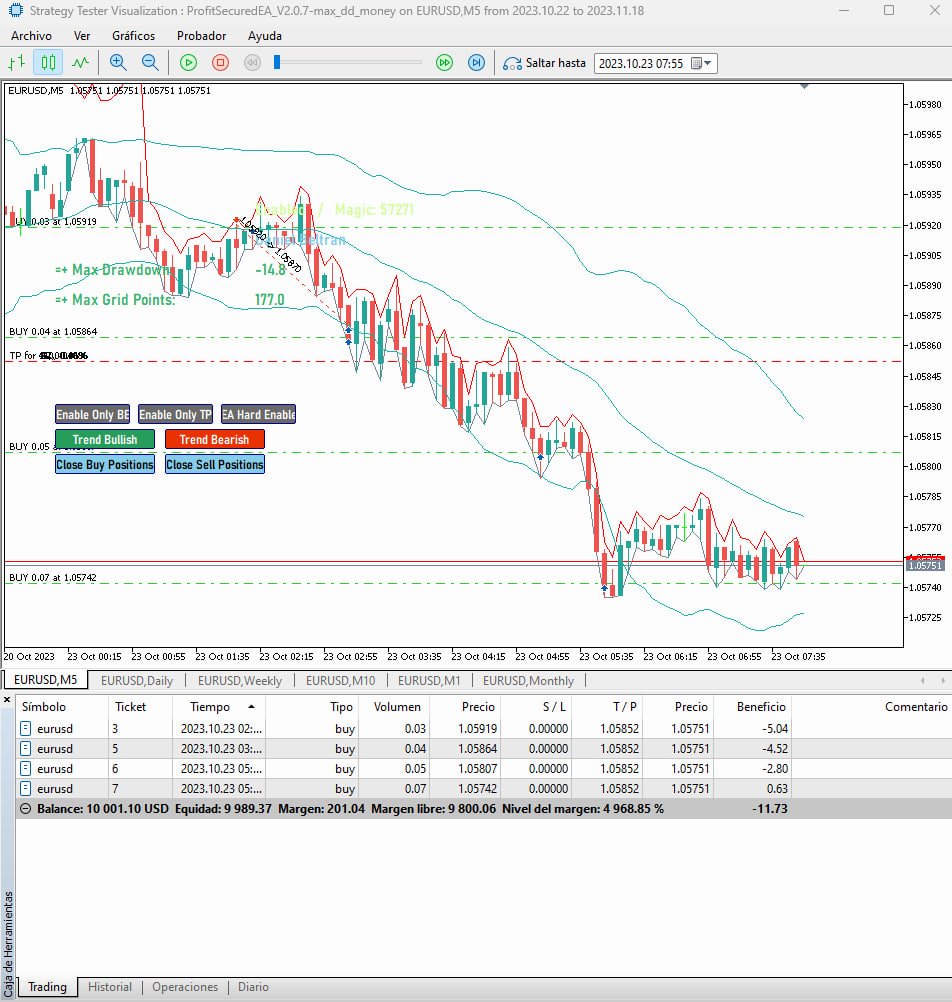
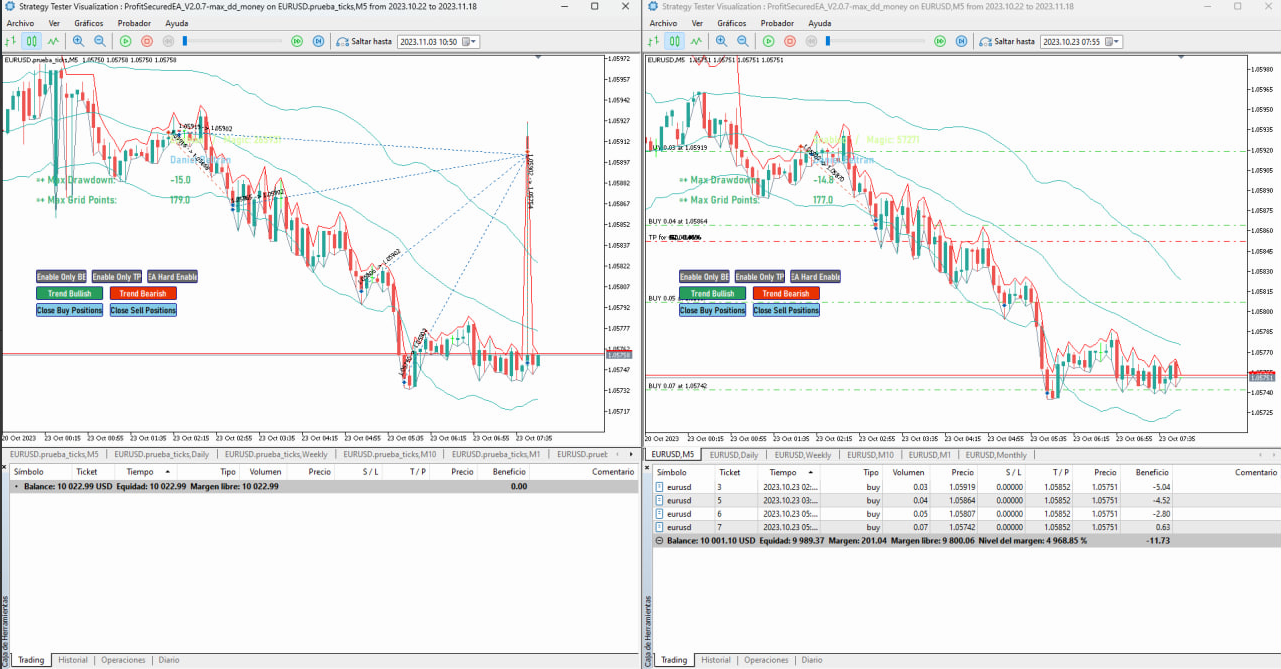
The data was downloaded correctly, but when testing it in the MT5 strategy tester with a modeling of "every tick based on real ticks", 2 simultaneous tests were carried out, one with the already mentioned data from tickstory and the other with the data of the FTMO broker, and we find errors in the tickstory data, we see disproportionate movements in some candles compared to the FTMO data, they are movements that in our opinion are not real and they are even movements that do not exist in charts of the different liquidity providers that are displayed in TradingView, so we consider that the downloaded data has errors. I proceed to leave images of the mentioned data errors:
Data Ticksotry:
Data FTMO:
Comparison of both (Left tickstory - Right FTMO):
It should be noted that we are using the free version of tickstory, if this problem has a solution with the paid version, I would proceed to purchase the annual license.
MT5 Tick Data Issues
Re: MT5 Tick Data Issues
Hi DBeltranOficial,
Please see the attached chart from the period you mention. The chart is from the "Show chart" feature in Tickstory. You will note there no spike in the data. Please make sure you are using an official copy of our software downloaded only from our website. After that, use the "Show chart" to view the data period in question. If you see any anomalies then please give us the full screenshot of the version of software you are using with the About window and Chart in view so we can investigate it further.
Thanks.